Survey of Math Chapter 6: Exploring Data
Example of Histogram
Table 6.5 (reproduced below) in the text (For All Practical Purposes 6th Ed. COMAP) gives the number of medical doctors per 100,000 people in each state. Construct a histogram of the distribution, and describe the distribution.
| State | Doctors | State | Doctors | State | Doctors |
|---|---|---|---|---|---|
| AL | 198 | LA | 246 | OH | 235 |
| AK | 167 | ME | 223 | OK | 169 |
| AZ | 202 | MD | 374 | OR | 225 |
| AR | 190 | MA | 412 | PA | 291 |
| CA | 247 | MI | 224 | RI | 338 |
| CO | 238 | MN | 249 | SC | 207 |
| CT | 354 | MS | 163 | SD | 184 |
| DE | 234 | MO | 230 | TN | 246 |
| FL | 238 | MT | 190 | TX | 203 |
| GA | 211 | NE | 218 | UT | 200 |
| HI | 265 | NV | 173 | VT | 305 |
| ID | 154 | NH | 237 | VA | 241 |
| IL | 260 | NJ | 295 | WA | 235 |
| IN | 195 | NM | 212 | WV | 215 |
| IA | 173 | NY | 387 | WI | 227 |
| KS | 203 | NC | 232 | WY | 171 |
| KY | 209 | ND | 222 | DC | 737 |
Solution
The individuals here are the states. The variable is the number of medical doctors per 100,000 people, which varies from state to state.
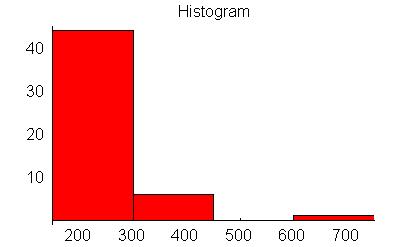
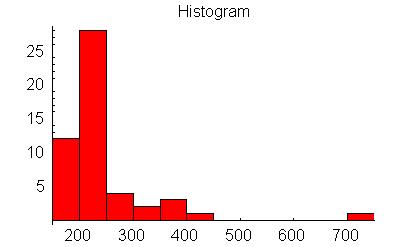
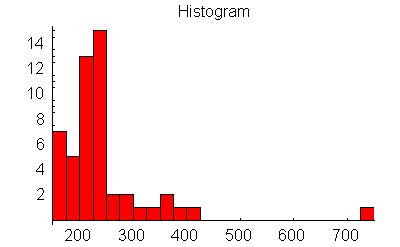
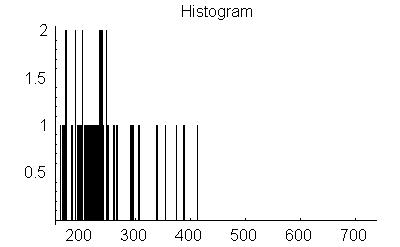
Here are four histograms I have constructed to graphically represent the data. The width of the vertical bars has been changed in each case.


We see that choosing the width of the bars is important. If our width is too wide, the histogram does not represent the fluctuations in height as well as we might like. If the width is too small, the histogram represents the fluctuations in height too well, and we get a histogram with drastic variations in height.
The best histograms strike a balance when choosing the width of the bars. The two with widths 50 and 25 produce pretty good graphical representation of the data. Let's choose the following histogram to work with:

There appears to be one outlier in the distribution, which corresponds to the District of Columbia. Since The District of Columbia is a city and not a state, it is not surprising that it has a different value for the variables than the other states. We can ignore this outlier as we continue with our description of the distribution.
The distribution appears to have one peak, in the 225-250 band. If you calculate the mean of the distribution you will find it to be 244, and the median is 225.
The distribution is right skewed (not symmetric), since from the center the distribution extends further to the right (425) rather than the left (150).